GA4 raw data export – why is it a big deal?
Google Analytics 4 introduces the ability to export raw data to BigQuery, a fast data warehouse available on the Google Cloud Platform. This is a revolutionary change, so far unavailable to most Google Analytics users. Why is raw data export so important? How to unleash its potential? Find out in this article.
Why such a change?
Companies that previously wanted to use the data collected by Universal Analytics, GA4’s predecessor, had a serious dilemma. They had to upgrade to the premium version paying $150,000 a year or rely on sampled data from GA’s custom reports. In addition, the problem was the limited number of custom metrics and dimensions that would allow them to transform and expand the scope of analyses.
So why such a drastic change in Google policy?
First, data is becoming an increasingly valuable asset at the disposal of companies. The ability to use data to make business decisions in a short time is a source of competitive advantage on the market. Whoever better identifies market signals on the basis of the data, wins the client.
At the same time, the average cost of data storage and processing is systematically decreasing. Pay-As-You-Go models, available on cloud platforms of technological giants, democratise access to processing large data sets.
With the introduction of GA4 and the option to export data to BigQuery, Google is therefore encouraging existing GA users to switch to their cloud products offered as part of the Google Cloud Platform.
How to use the raw data collected in GA4?
So what are the possibilities offered by GA4’s raw data analysis? Below is our list of 5 examples of how data can help make strategic decisions in companies that sell online.
1. Validation of transactions collected in GA4
A typical configuration of Google Analytics takes into account the registration of transactions that take place on the store’s website. As a result, we have information about the number of transactions, revenue or products sold, and we can group them according to the source of user acquisition. Such an analysis is extremely valuable because it allows you to assess the effectiveness of marketing activities or budgets spent.
However, such an analysis rarely takes into account the statuses of registered transactions. Have they actually been confirmed, paid and the customer not withdrawn from the transaction in the following days e.g. by making a refund? Additionally, does Google Analytics actually record all transactions made? What about people who, after paying for the order, did not return directly from the payment system to the store’s website (according to our observations, it is about 15-20% of users)? As a result, GA transaction data may be inaccurate and may lead to wrong decisions.
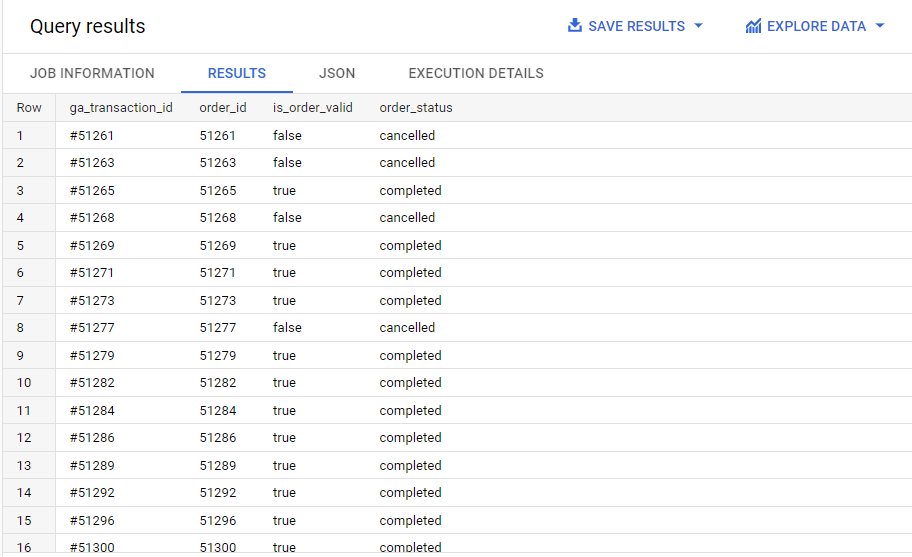
Description: Table with GA4 transactions and their validation based on data from the e-commerce platform
With the export of transaction data to the warehouse, we can perform additional validation. Using the data from the e-commerce system, we can successively mark only truly completed transactions, supplement the data with missing transactions (invisible to GA) and on their basis conduct reliable analyses of the effectiveness of the campaigns carried out.
2. Combining data on revenues and marketing costs
Having data on the actual revenues assigned to individual traffic sources, we can go a step further and compare them with the marketing costs.
Most advertising platforms (Facebook, Google Ads or TikTok) provide access to the reporting API free of charge, which allows you to download and upload campaign cost data to the warehouse.
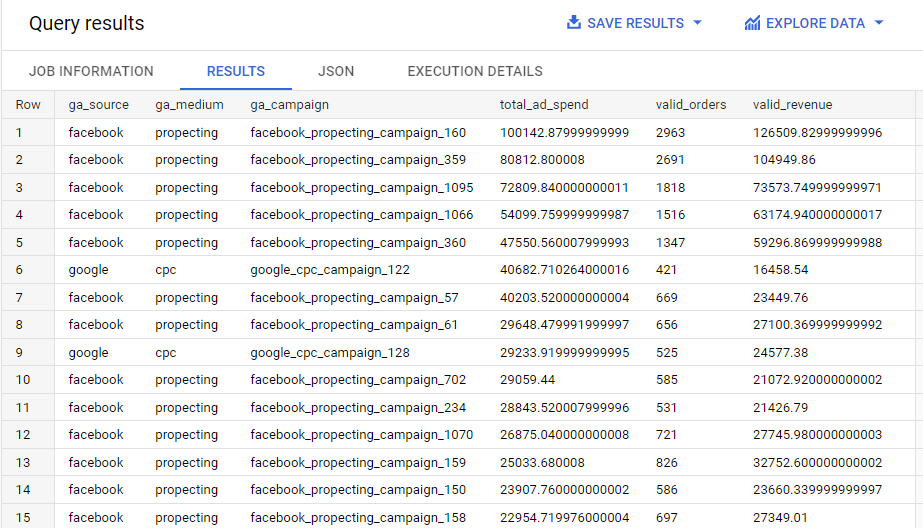
Description: Advertising revenues and costs at the advertising campaign level
By using appropriate ad tagging, we can match this data with traffic data from GA4. This will allow us to calculate actual ROI rates for channels and marketing campaigns. Importantly, such an analysis will avoid duplication of the counted orders, which always occurs when summing up data from advertising panels. For example, a user going to a website from a Facebook campaign and then Google Ads and making an order will be included in both panels as a buyer. Each panel only has traffic data limited to its advertising ecosystem.
3. Looking at the customer, not the order
In businesses that rely on repeated sales to customers (e.g. in the form of a subscription), a much more important event than acquiring an order is acquiring a new customer (or preferably a subscriber). By analysing the purchase history of existing customers and subscribers, we can forecast the customer’s value (the so-called Lifetime Value) and predict their future orders with high probability.
For this reason, the assessment of marketing channels based on customer / subscriber acquisition cost is much more precise than the popular ROI or ROAS (measured as the ratio of revenue to the marketing cost).
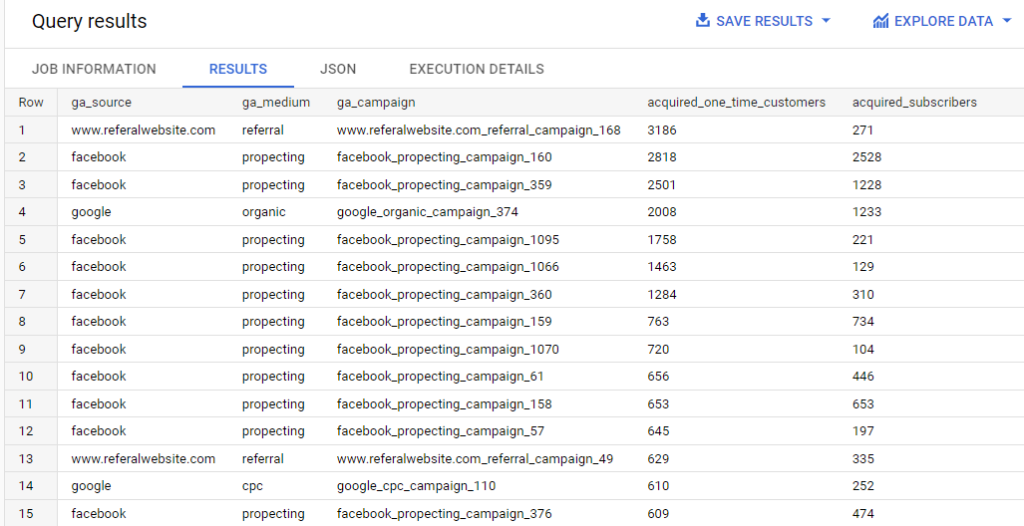
Description: Number of acquired customers and subscribers broken down by marketing campaign
By processing the raw data from GA4, we can easily perform this analysis and verify which sources and campaigns mainly provide one-off transactions, and which bring in loyal and valuable customers.
4. Custom attribution model
GA4 introduces the ability to choose from many built-in attribution models, including a data-driven model based on artificial intelligence algorithms. With all the advantages of this solution, and most of all its ease of use, it remains a black box that we must trust and over which we have limited control.
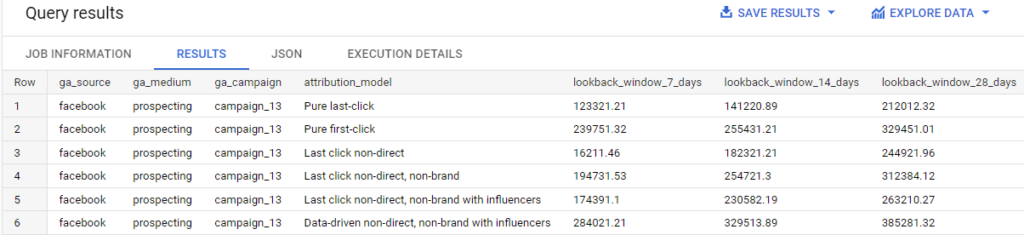
Description: Comparison of revenues from FB campaigns for 6 proprietary attribution models and three conversion windows
Companies that need more control and the ability to customise attribution models, thanks to the export of raw data from GA4, can recreate customer conversion paths themselves and create models tailored to their own needs. Excluding brand words, orders with influencer code or marking subscription orders from attribution are just a few examples of how it can be adapted to the goals and specificity of a given business.
5. LTV and CAC modelling at the level of marketing sources
Most organisations struggle with data silos and separate reports from each silo. Data available for one team is not available for another, and the results of the analyses may lead to opposite conclusions. Now, using the raw data, it is finally possible to solve this problem and break down existing silos.
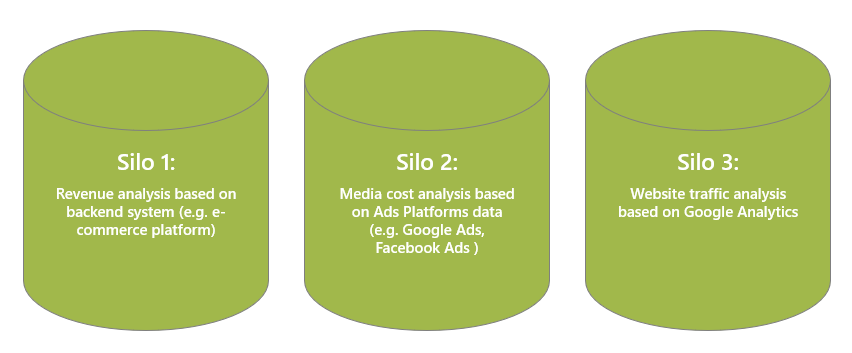
By combining data from the above sources in the warehouse, we can build a system that allows you to compare the Lifetime Value of individual customer segments with the cost of their acquisition (CAC). This allows for quick and effective tests of many hypotheses concerning, among others, traffic sources, customer campaigns, products or creative ideas.
Examples of possibilities below:
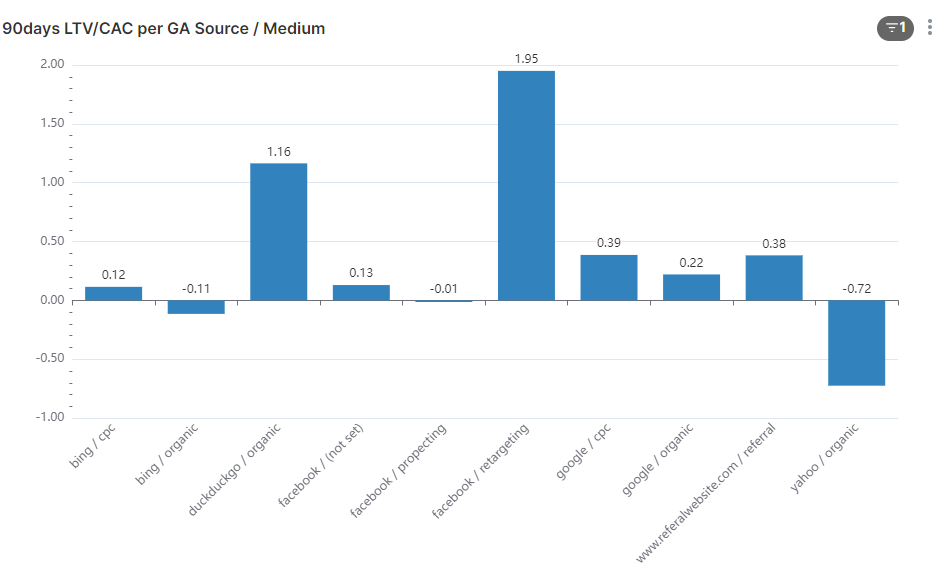
Description: Summary of LTV / CAC by source of acquisition
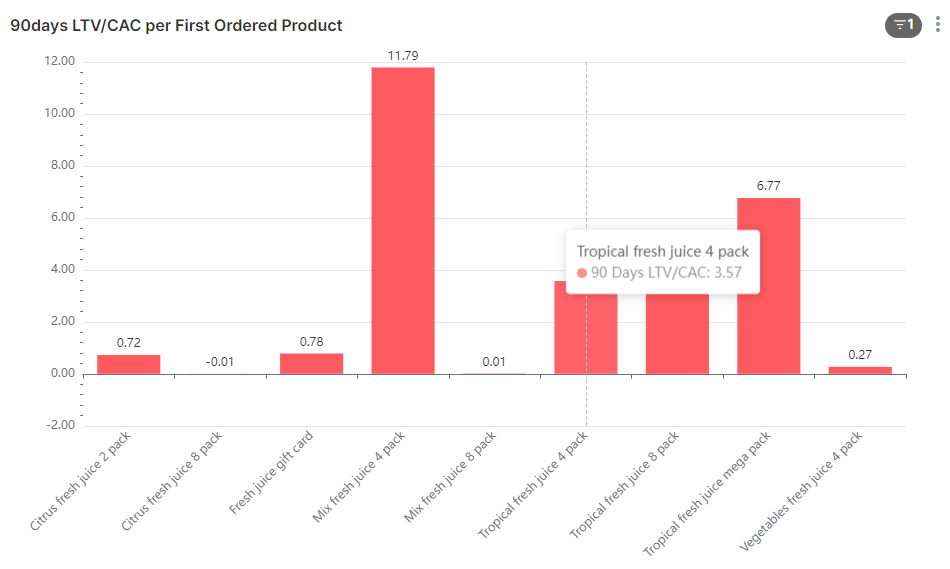
Description: List of LTV / CAC according to the ordered product in the first order
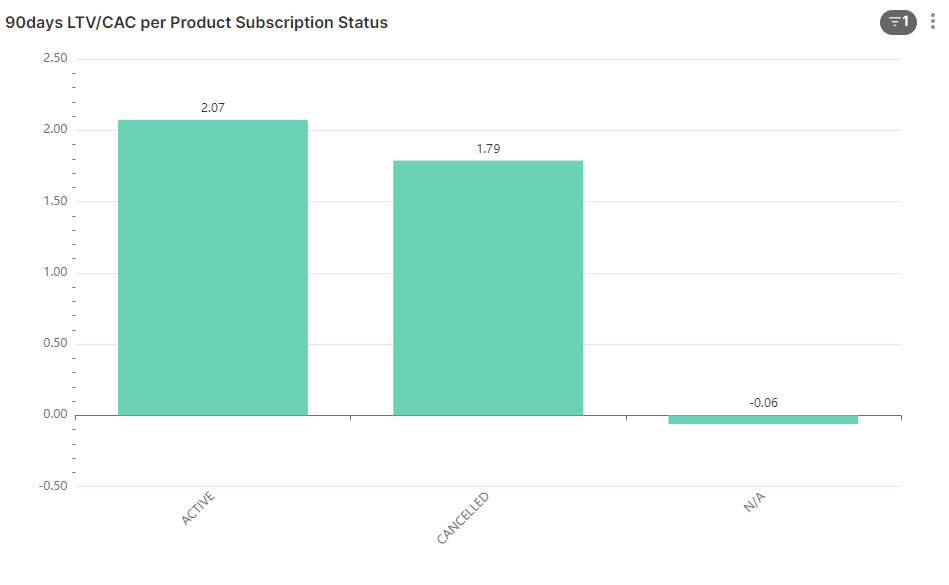
Description: LTV / CAC breakdown by customer subscription status
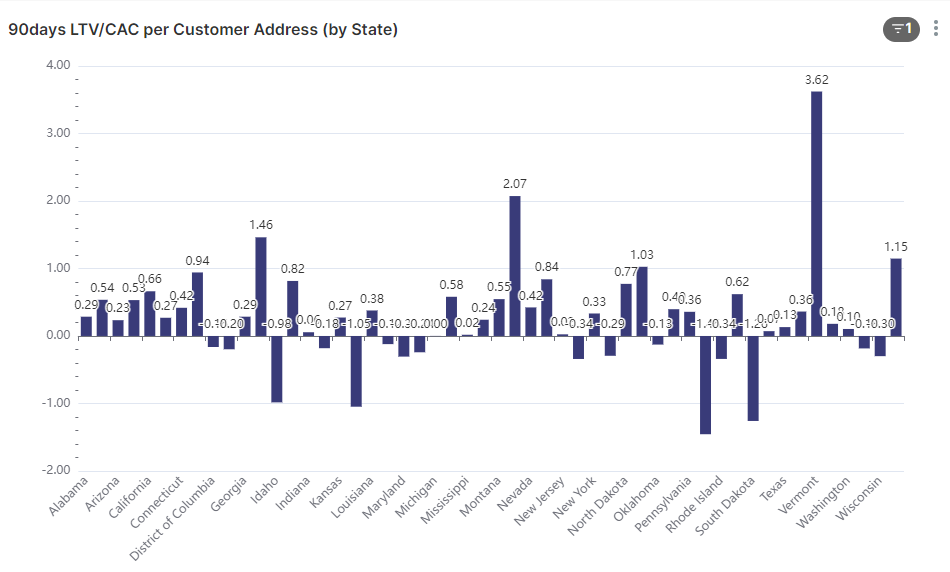
Description: LTV / CAC breakdown by customer’s home address
What is needed to start analysing raw data?
In order to be able to conduct analyzes based on raw data, the following steps are necessary:
- Correctly configured GA4 with Data Layer
- Configured BigQuery account with payment setup
- Enabled export of GA4 data to Bigquery
- Connecting additional data sources to BigQuery (e.g. Facebook Ads, E-commerce Platform) *
- Data processing in BigQuery (e.g. DBT, Dataform)
- Data visualisation tool connected (Google Data Studio, Tableau / PowerBi, Apache Superset)
- Building metrics and visualisations
*optional step
In the next article, we will share some ideas how to combine mobile app data in GA4.
If you have questions related to the topics covered in this article, write to us!
Strategy & Data Analytics expert with 10+ years of experience in analytics, performance marketing and strategic consulting – ex-iProspect, ex-ATKearney. When not writing SQLs, Piotr is most likely cycling.
- Written by: Piotr Futymski
- Posted on: 17/05/2022
- Tags: BigQuery, GA4, Google Universal Analytics